Summary
In the third quarter of 2025, clean energy and transportation investment in the United States totaled $75 billion, representing the highest quarter of investment on record. This growth, a 9% increase from the previous quarter and an 8% increase from the same period in 2024, was largely driven by unprecedented electric vehicle (EV) sales. Clean investment accounted for 5.3% of total private investment in structures, equipment, and durable consumer goods, a new peak.
Retail consumer purchases of EVs and other clean technology (heat pumps, distributed generation, and storage) accounted for more than half of the total at $41 billion. This segment experienced a 19% increase quarter-on-quarter and a 17% increase compared to Q3 2024. By contrast, investments in clean energy technology manufacturing declined for a fourth consecutive quarter to $10 billion, representing a 10% decrease from the previous quarter and a 26% decrease compared to the same period last year. Investments in utility-scale clean electricity and industrial decarbonization technologies increased by 3% quarter-on-quarter to $25 billion, up 15% compared to Q3 2024.
The pipeline of new project announcements varied across segments. Utility-scale clean electricity announcements totaled $20 billion, mostly in solar and storage, up 1% relative to the previous quarter, but down by one-third from Q3 2024. New industrial decarbonization announcements totaled $3 billion, representing a 53% quarter-on-quarter increase but a 56% decline compared to Q3 2024. Developers canceled roughly $2 billion of investments in energy and industry projects this quarter, compared to $7 billion in cancellations during the previous quarter. In manufacturing, canceled projects also totaled $2 billion, less than half of the $5 billion in Q2 2025 cancellations. Announcements in manufacturing projects stood at roughly $6 billion, mostly driven by the EV supply chain, a 27% increase quarter-on-quarter, but a 9% drop relative to this same period last year.
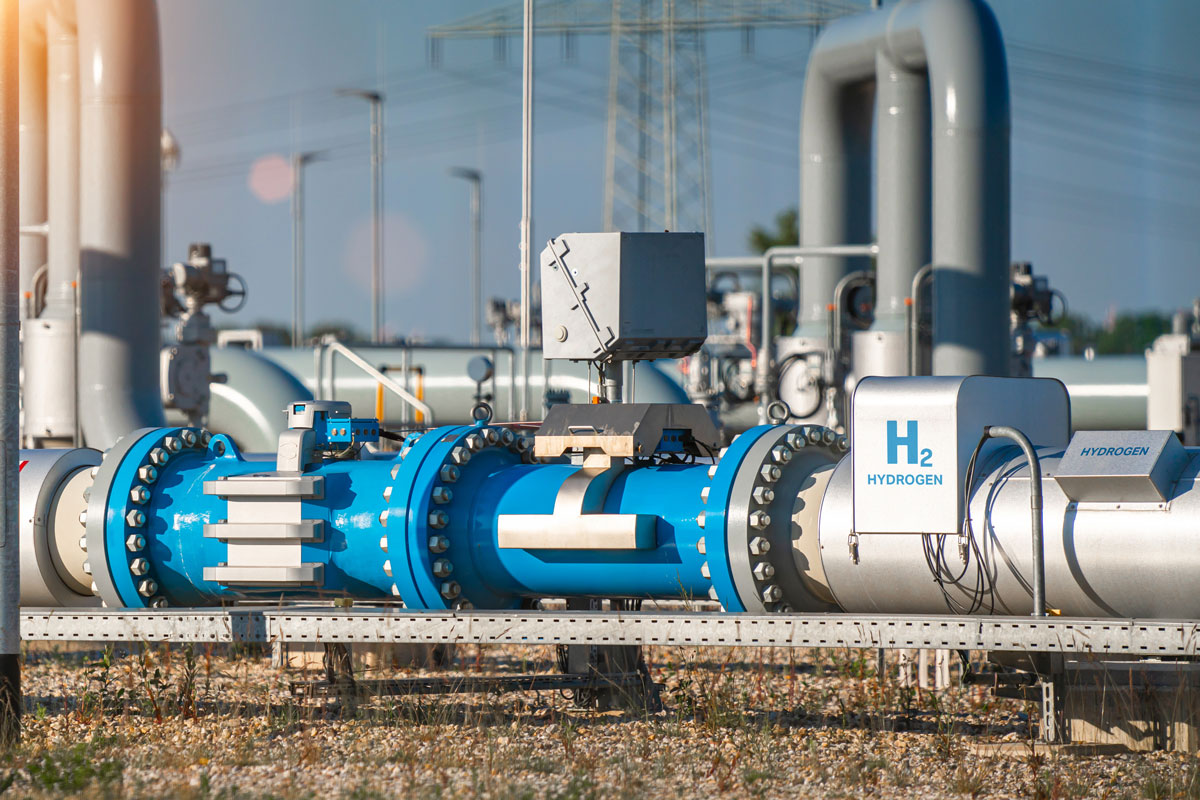
In addition to summarizing trends from our quarterly update to the Clean Investment Monitor, this report also analyzes industrial decarbonization technologies, which lag in converting announcements into actual spending. Only $1 of every $10 announced in this sector—which includes hydrogen and carbon management—has been invested, compared to the roughly $6 of $10 actualized in both clean electricity and manufacturing. From Q1 2018 through Q3 2025, companies have canceled $17 billion worth of industrial decarbonization projects, exceeding the $15 billion invested over the same period in constructing and installing the 57 industrial decarbonization facilities that have begun operating in the US. Looking ahead, $136 billion in outstanding investment remains to be spent across 229 projects in the pipeline that have either not broken ground or are currently under construction. This report also offers a lens into how recently surfaced lists of Department of Energy grant terminations overlap with that pipeline of outstanding investment. We find $14 billion of outstanding investment in the industrial decarbonization sector is tied to projects with potential and confirmed award terminations, representing 10% of the total outstanding investment in the space. We provide a breakdown by technology.
Investment trends
Actual clean energy and transportation investment in the US in Q3 2025 reached a new record-high, totaling $75 billion (Figure 1). This surpasses the previous peak of $70 billion in Q3 2024 and marks a 9% increase quarter-on-quarter and an 8% increase compared to this same period last year. In Q3 2025, clean investment accounted for 5.3% of total US private investment in structures, equipment, and durable consumer goods nationwide, the highest share of investment on record, driven largely by a surge in EV sales (Figure 2).
We categorize our clean investment tracking into three segments: investment in the manufacture of GHG emission-reducing technology (“manufacturing”); investment in the deployment of that technology, both to produce clean energy or decarbonize industrial production (“energy and industry”); and investment through the purchase and installation of that technology by individual households and businesses (“retail”). Each dollar figure in this report reflects actual investment—the real dollars spent in the given quarter on retail purchases, facility construction, and equipment purchase and installation. For facilities, we track actual capital expenditures invested over the construction timeline once a project breaks ground. In the following sections of this report, we summarize actual and announced investments, which provide context and insight into potential future actual investments.
Retail investment accounted for 54% of total clean investment in Q3 2025 at $41 billion, with over three-fourths (76%) of spending in this segment attributed to EV sales. Actual retail investment increased 19% relative to the previous quarter, and 17% compared to Q2 2024. Manufacturing investment decreased for a fourth consecutive quarter to $10 billion, falling 10% quarter-on-quarter and down 26% compared to Q3 2024. In the energy and industry segment, $25 billion was invested in clean energy production and industrial decarbonization, a modest 3% increase from the previous quarter, and a 15% increase compared to Q3 2024. This quarter saw cancellations of $2 billion worth of investment in clean technology manufacturing projects, and another $2 billion in clean electricity and industrial decarbonization projects.
Manufacturing
Manufacturing investment dropped by 10% from Q2 2025 and declined 26% compared to Q3 2024. The EV supply chain—critical minerals, batteries, vehicle assembly, and charging equipment—remained the dominant force in clean manufacturing investment, accounting for $8 billion (83%) of the total $10 billion in actual investment (Figure 4). This level of EV supply chain investment reflects a 15% drop from Q2 2025 levels and 30% below the same period last year. Battery manufacturing investment fell by 23% quarter-on-quarter to $6 billion and declined a sizeable 37% relative to Q3 2024. Investment in solar manufacturing projects totaled around $2 billion in Q3 2025, up 34% from Q2 2025 and 6% from the same period last year.
Companies announced $6 billion in new manufacturing projects in Q3 2025, a 27% increase from the previous quarter but down 9% from Q3 2024, and representing the second-lowest quarter of announcements on record since Q2 2021, right behind Q2 2025. Most (99%) announcements in Q3 2025 were made in the EV supply chain, with $1 billion announced for batteries and close to $5 billion in EV projects.
During this period, companies canceled $2 billion worth of projects, the fourth-highest quarter on record after $2 billion of cancellations in Q3 2024, $5 billion in Q2 2025, and $7 billion in Q1 2025. Battery manufacturing made up most of the total cancellations for Q3 2025, while EV manufacturing projects drove most of last quarter’s cancellations.
Energy and industry
In Q3 2025, the US saw a total of $25 billion in actual investment in clean energy production and industrial decarbonization: up 3% quarter-on-quarter and up 15% relative to the same period in 2024. This represents the highest level of quarterly investment in this segment on record. Within energy and industry, most investment (96%) went towards clean electricity at an invested value of $24 billion, with the remaining $1 billion going towards industrial decarbonization projects.
Utility-scale solar and storage installations continued to dominate clean electricity investment, accounting for $17 billion, a 5% decrease from the previous quarter and a 3% decrease from this same period last year (Figure 5). In contrast, wind investment recorded a fifth consecutive quarterly increase, rising by 31% from the previous quarter to $7 billion in Q3 2025, marking the highest quarter of investment since 2020.
Industrial decarbonization investment declined 12% quarter-on-quarter and 23% relative to Q3 2024 (Figure 6). Hydrogen continues to lead actual investment in industry at $465 million, down 8% from the previous quarter and 12% compared to Q3 2024. Sustainable aviation fuel (SAF) investment dropped to $152 million, a 22% decline quarter-on-quarter and a sizeable 62% dip compared to Q3 2024. Carbon management investment was down 22% from the previous quarter, to $123 million. Clean fuels saw $87 million of investment, and $74 million was invested in clean iron and steel production, roughly on par with the level of investment in both technologies during the previous quarter.
The pipeline of new energy projects expanded slightly in Q3 2025, with the addition of $20 billion in new utility electricity project announcements, representing a 1% increase from the previous quarter but down by one-third from the same period last year. Most (96%) of these announcements continue to be from solar and storage.
Industry announcements totaled $3 billion, representing a 53% increase compared to the previous quarter, but still down 56% relative to Q3 2024. So far in 2025, companies have announced $2 billion of investment each quarter, on average, a stark difference from the $8 billion quarterly average level of announcements in 2024 and $10 billion in 2023. We focus here on averages to provide clarity on the annual momentum for US industrial decarbonization projects.
Cancellations across the energy and industry segment reached $2 billion this quarter, down 73% from the previous quarter, but up 22% compared to Q3 2024. Solar, storage, and hydrogen cancellations contributed most to this total.
Retail
Consumer spending on zero-emission vehicles (ZEVs), distributed renewable electricity generation and storage, and heat pumps totaled $41 billion in Q3 2025, a new record high quarter. This level of spending represents a 19% increase from Q2 2025, and a 17% increase from the previous peak of $35 billion in Q3 2024.
Investments in ZEVs drove this surge, reaching $31 billion—a record uptick in ZEV sales at a 32% increase from the previous quarter and 30% from the same period last year. This quarter, capped by the September 30 sunset of EV consumer tax credits, marks a new record high for investment in ZEVs (Figure 7).
Distributed electricity generation and storage investment fell 4% from the previous quarter and down 5% compared to Q3 2024, totaling $4 billion in investment. This marks the second consecutive quarter of decline. Investments in heat pumps, which stood at $6 billion, declined both quarter-on-quarter and relative to Q3 2024, by 15% and 17%, respectively. Consumer tax credits to support the purchase and installation of these technologies also expire at the end of this year.
Assessing industrial decarbonization investments amid DOE funding turbulence
The Clean Investment Monitor tracks investment since 2018 in emerging climate technologies—hydrogen, SAF, other clean fuels, carbon management, and new approaches to decarbonizing the production of cement, iron and steel, and pulp and paper—that aim to reduce industry emissions, the second highest-emitting sector in the US. From the start of 2018 through Q3 2025 (September 30, 2025), companies have invested $15 billion in constructing and installing new industrial decarbonization facilities, and 57 projects have started operating across the country. Looking ahead, $136 billion of outstanding investment remains to be spent on 229 announced projects that have not yet broken ground or are currently under construction. This pipeline excludes $17 billion worth of projects that have been canceled, underscoring the headwinds facing these early-stage technologies.
Compared to clean electricity investment—also captured within the Clean Investment Monitor’s energy and industry segment—industrial decarbonization lags in converting announcements into spending. Only $1 of every $10 announced since Q1 2018 has been invested as of Q3 2025, significantly less than the roughly $6 in every $10 that has been actualized in both clean electricity and manufacturing projects we track. This low ratio of investment relates to the early-stage nature of many industrial decarbonization technologies, which are generally dependent on a mix of external public and private funding, as well as policy initiatives to facilitate commercialization, and often contingent on securing offtake agreements for their product.
Recent turbulence in federal funding awards from the Department of Energy (DOE), particularly through the Office of Clean Energy Demonstrations, could further complicate industrial decarbonization—especially for the 64% of projects that have not yet broken ground. In October 2025, DOE announced nearly $8 billion in funding terminations for more than 200 energy projects, revoking over 300 awards. Days later, an unconfirmed list detailing these and additional grant terminations circulated on Capitol Hill. These actions follow $4 billion in funding terminations announced in May 2025 for 24 clean energy grants. Though not all the projects appearing on these lists fall within the Clean Investment Monitor’s scope of coverage, we cross-walked the available information with our database to identify industrial decarbonization projects subject to potential or confirmed termination of DOE awards. We find $14 billion in outstanding investment is tied to the projects included on those award termination lists, representing 10% of the outstanding industrial decarbonization investment, and spread unevenly across technologies (Figure 8).
First-of-a-kind facilities aiming to produce decarbonized cement and pulp & paper appear to be most exposed to the DOE award terminations. For cement, projects appearing on the award termination lists account for roughly $2 billion of total announced investment—representing about 93% of the sector overall and 99% of outstanding investment. The single announced US facility for producing decarbonized pulp and paper also appeared on an award termination list, thus representing 100% of outstanding investment in this nascent space. Low-carbon iron and steel, by contrast, is further along in terms of actualized investment, with 86% of the $4 billion announced projects already invested since 2018. None of the remaining outstanding investment is tied to the award termination lists.
In carbon management, which includes direct air capture, point-source capture in the power sector, and carbon dioxide utilization and removal, only 5% of the total $29 billion announced in this sector since 2018 has been invested, leaving 95% of the investment outstanding. Projects tied to $7 billion of outstanding investment, almost one-fourth of the yet-to-be-realized $28 billion in spending, appeared on the award termination lists.
Hydrogen projects tracked by the Clean Investment Monitor include both green hydrogen produced with electrolyzers powered by clean electricity and blue hydrogen production that integrates carbon capture, which together have attracted more than $61 billion of announced investment since 2018. Companies have canceled more than $7 billion of projects, including some that were already under construction, while $5 billion has been invested, primarily in green hydrogen. Another $50 billion remains outstanding across all hydrogen projects. Several hydrogen-production facilities in our tracking are associated with seven hydrogen hubs that have appeared on the award termination lists. Collectively, these account for $5 billion or 9% of the outstanding investment in hydrogen as of Q3 2025.
SAF and other clean fuels projects stand out as sectors that did not appear on the award termination lists. SAF, produced through various production processes from waste-derived feedstocks, accounts for 30% of all industrial decarbonization investment, at around $4 billion. Still, 92%, or $53 billion, of announced SAF investment remains outstanding as of Q3 2025. Clean fuels, including ethanol produced with carbon capture, have a narrower pipeline of $2 billion in outstanding investment, equivalent to 88% of announcements in this technology since 2018.
In Q4, we will be monitoring the impact of the DOE award terminations and changes to tax incentives enacted under the One Big Beautiful Bill Act on the industrial decarbonization landscape. Many projects rely on complex funding arrangements that include federal cost-sharing combined with state or municipal support, equity investors, and long-term offtake agreements. Early signals of the ripple effect from federal award terminations would include construction pauses, revisions to project timelines, or private-sector partnerships emerging to fill funding gaps.