The Clean Investment Monitor (CIM), created by Rhodium Group and MIT’s Center for Energy and Environmental Policy Research, tracks investments in the manufacture and deployment of clean energy and decarbonization technologies in every country around the world. Through our detailed, facility-level data and in-depth analysis, we provide insights into investment trends, the pace and scale of new clean technology manufacturing capacity, and the impact of policies on the evolving global clean energy landscape.
Here we detail the methodology used for the United States component of the CIM database. To establish a historical baseline against which to assess recent developments, the database includes all covered investments since 2018. This results in a database with roughly 22,000 individual facilities, 5 million zero emission vehicle registrations, 28 million heat pump sales, and 4.5 million distributed electricity generation or storage installations as of Q4 2025.
CIM reports quarterly and annual investment totals for manufacturing and deployment of covered technologies, enabling consistent analysis of trends. As outlined below, investment amounts are temporally allocated and presented in real dollar terms to ensure comparability over time. All investment figures are in 2024 U.S. dollars. The database is updated quarterly and includes facility-level project tracking, aggregated investment by state and congressional district, and associated employment estimates available on Rhodium’s ClimateDeck platform.
In addition to private sector investment, CIM reports estimated financial support from the US federal government for covered sectors, including tax credits, grants, loans, and loan guarantees. These estimates are presented as a quarterly time series, aligned to the period in which eligible activity occurs or federal outlays are made.
How we categorize investment
When the Bureau of Economic Analysis (BEA) reports overall investment trends for the U.S. economy, they capture both investment in structures and equipment (like factories), as well as the purchase of durable consumer goods (like automobiles). We have taken a similar approach with CIM, for comparability to BEA aggregate investment data. We break out clean investment into three “segments”: investment in the manufacture of GHG-reducing technology (“Manufacturing”), and investment in the deployment of that technology, both to produce clean energy or decarbonize industrial production (“Energy and Industry”), and through the purchase and installation of that technology by individual households and businesses (“Retail”).
Our headline figures report actual investment, or the real dollars spent during a quarter on retail purchases or new facility construction. For example, when we confirm an announced facility breaks ground, we begin tracking actual investment in its construction and equipment. We also provide data on announced project investments in the Manufacturing and Energy and Industry segment to provide context and insight into potential future actual investments.
For the Manufacturing and Energy and Industry segments, we track investment at the individual project level through a combination of third-party data sources, company announcements and financial filings and news reports. Projects are monitored from initial announcement through construction to operation. We only include projects as “announced” in our database when a specific location and timeline for the project has been specified, and, in the case of larger projects, Front-end Engineering Design (FEED) work has begun. When project investment amounts are reported by the company, we use those in CIM; otherwise, we estimate investment amounts using reported project-specific technology and capacity/production information and an investment cost model calibrated with recent data from comparable projects. Total investment costs are spread over the life of the reported construction period. When construction timelines are not available, they are estimated based on average construction times for similar projects. To see how announced investment amounts are distributed over time, see figures 2 and 4 in our inaugural report.
For the Retail segment, we rely on third-party state-level data. For ZEVs, we combine state-level vehicle registration data by make and model from S&P Global with MSRP data from FuelEconomy.gov, Edmonds.com and other sources. For heat pumps, we downscale national sales data from the Air-Conditioning, Heating and Refrigeration Institute (AHRI) and the federal Energy Star program to the state level using the Energy Information Administration’s (EIA) Residential Energy Consumption Survey. We estimate investment cost using data from the EIA. In the case of distributed renewable electricity generation and storage, we use state-level installation data from the EIA and installation cost data from the National Renewable Energy Laboratory (NREL). For Retail, we treat all investment as occurring in the quarter in which the registration, sale or installation is reported.
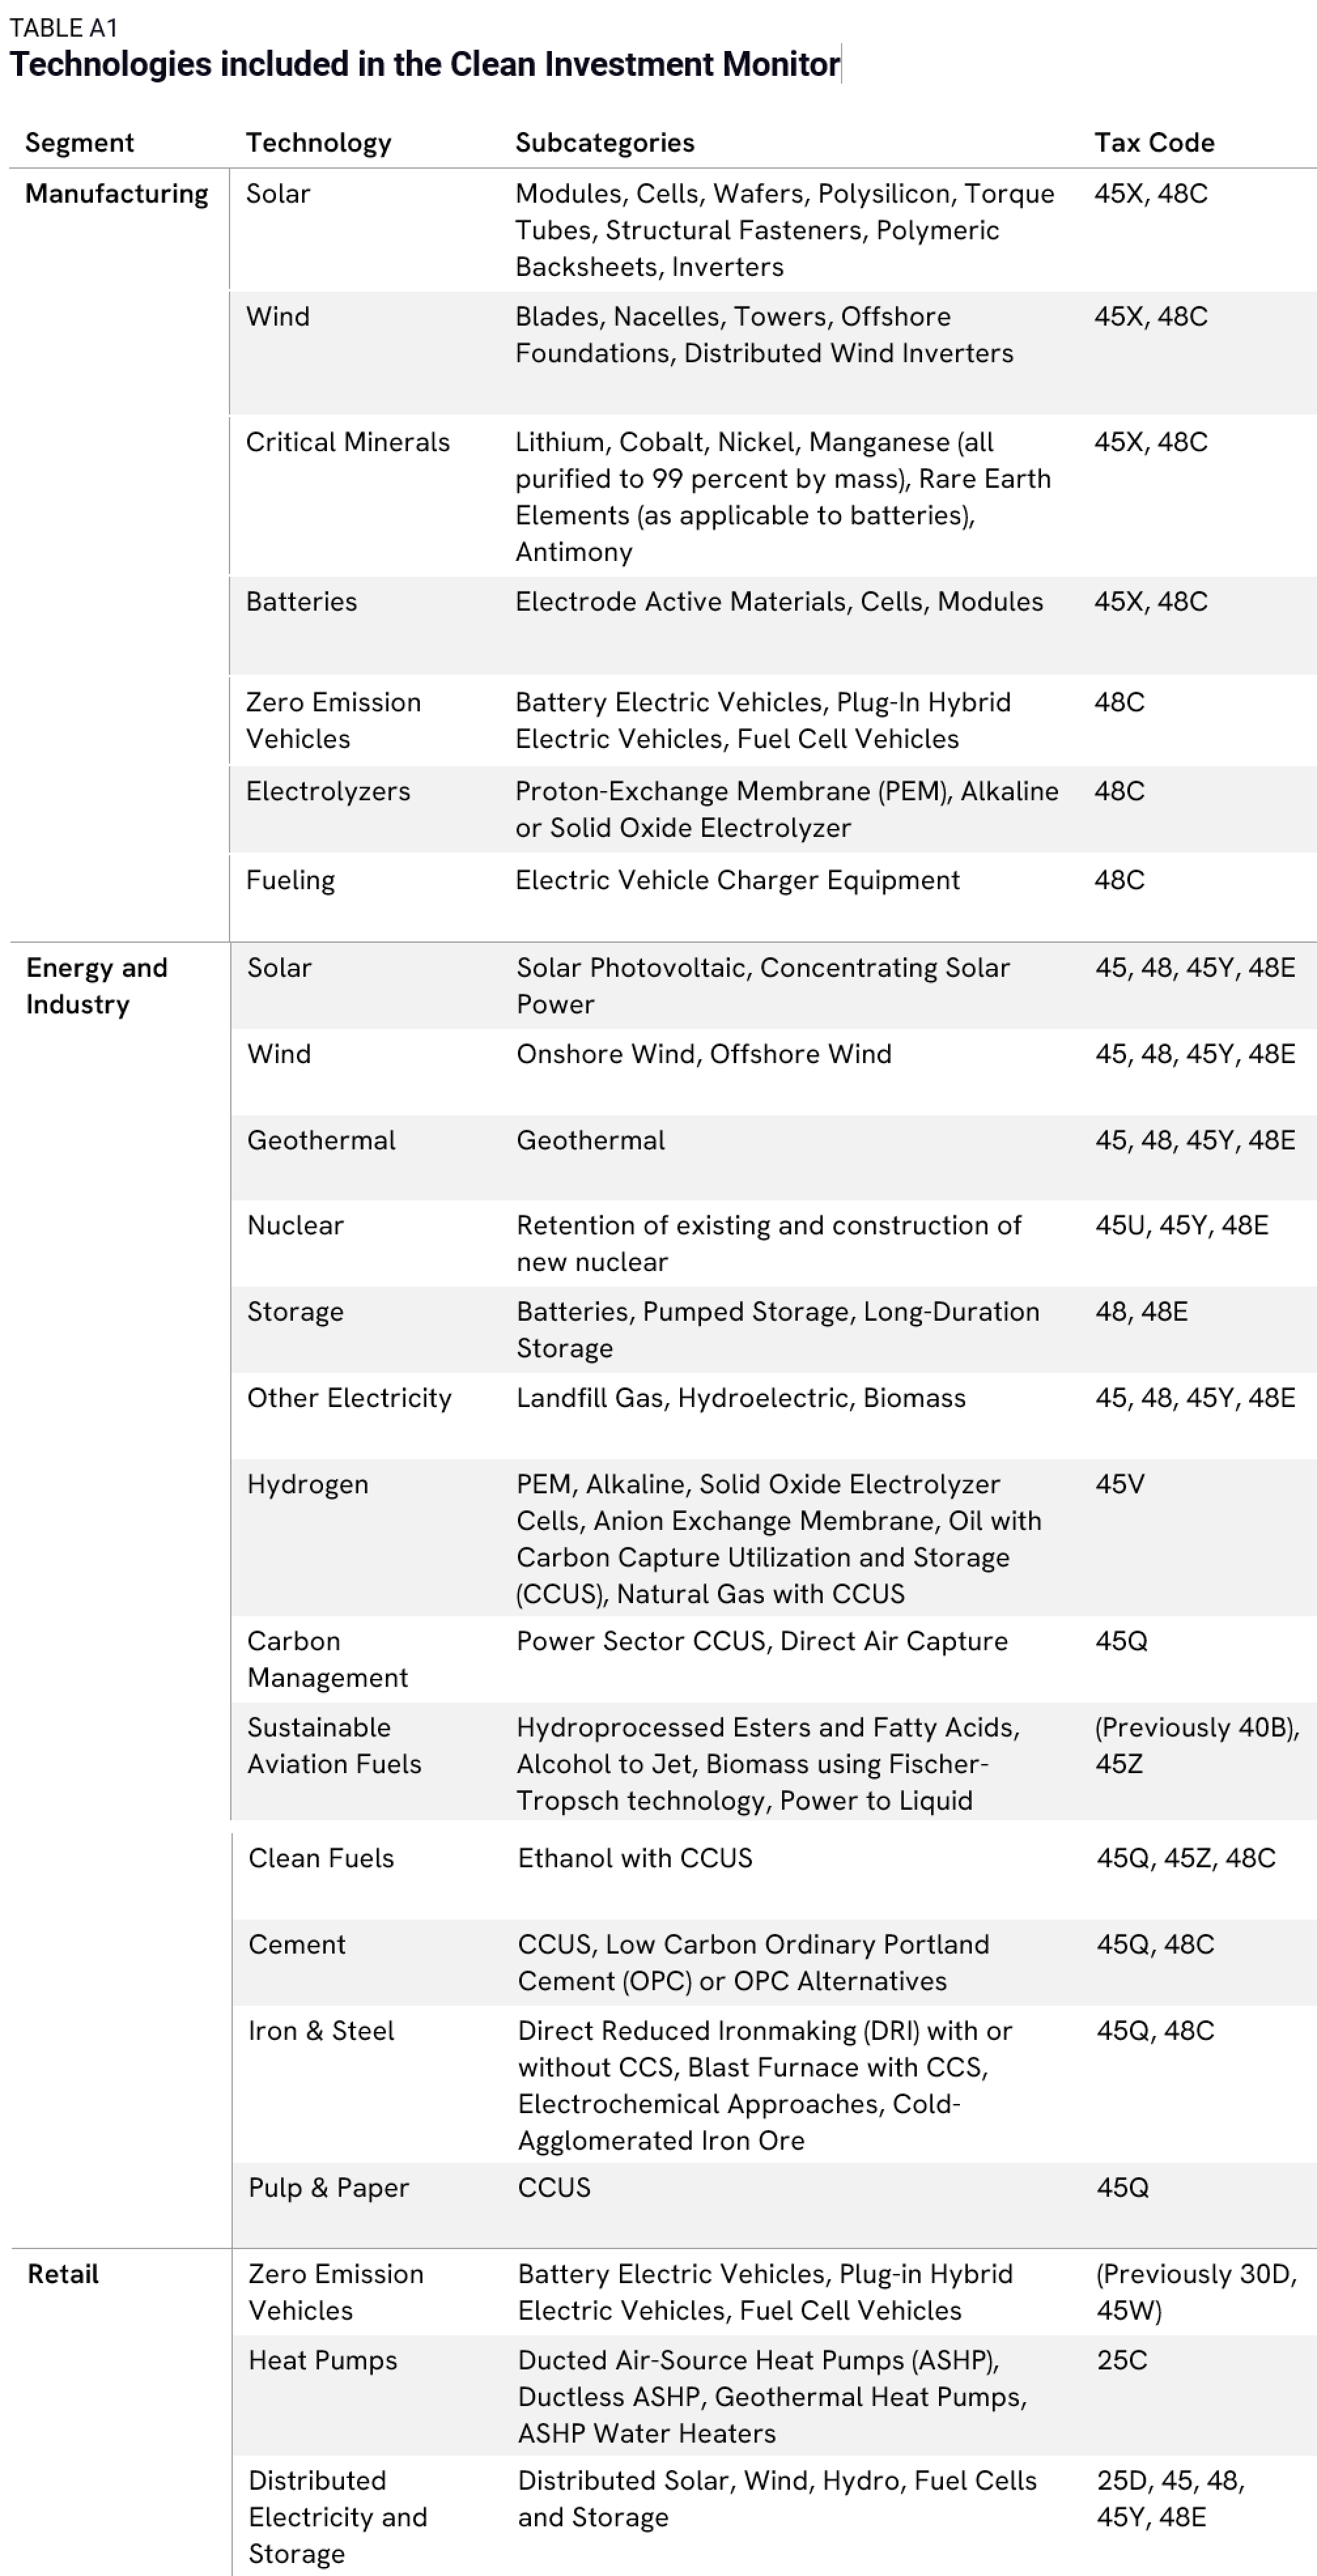
Technologies included in our US database
The table below provides a detailed breakdown of the technologies currently included in our US database, along with the corresponding section of the tax code under which they receive incentives.